
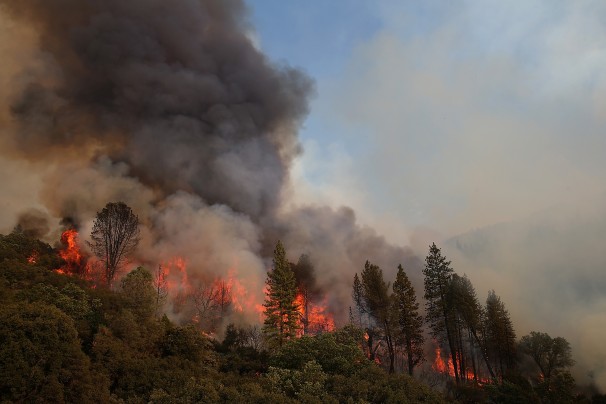
The enormously destructive spread during the summer of 2013 of a wildfire that began just outside Yosemite National Park, as an illegal fire begun by a hunter spread to consume almost 5,000 acres of protected lands. The scope of its spread challenges skills of mapping, and raises questions of managing wilderness and containing wind-driven flames. Even at a distance of three years, the costs of the unmanageably rapid spread of fires is visible in the charred remains of burnt trees that stand, as carbonated sentinels, along the highways one is likely to enter Yosemite Valley. They are reminders of the fire that began in the nearby Stanislaus National Forest and raged uncontrollably over weeks, consuming almost 260,000 acres of protected lands in the Sierra Nevada over two months. Even today, expanses of scorched areas with limited green after-growth mutely pose the sort of questions we are compelled to return to maps to resolve, but that current techniques seem inadequate to resolve by imposing layers over a terrestrial base-map.
The mapping of fires is both a cutting edge technology of interactive web mapping, able to track progress, intensity, and rates of evacuation from burning lands with local burn rates with a degree of GPS precision able to synthesize a greater range of data about fires than we have earlier had at our control. But are the maps of fires effective measurements of the scale of destruction or even the pathways of communication of dangers from fire–a danger increased with the growing number of unsupervised fires in wilderness areas where many homeless are increasingly based, and adequate resources not dedicated–and the spread of fire is simply not able to be that easily mapped.

The steep costs of such fires are not only unable to be comprehended, but so is their scale. If we map fires to better understand their spread–and the speed at which they travel, as well as the violence of their impact on protected terrain–The cost of this inability to chart the rapid spread of the fire suggest the difficulty to grasp the immensity of the costs of its current danger to the Eastern Sierras–a monumental expanse whose protection constitutes among the most valuable of America’s assets–both the difficulty of charting the ferocity by which fires threaten to destroy, the need for their prevention, and indeed the costs of failing to conceptualize the destructive costs of fires’ containment. For if the charred remains of dead redwoods and sequoia suggest the unstoppable progress of the fire in the hot summer of 2013, they remind us that increased summer heat threaten to incredibly steep costs and pose future challenges for mapping the spread of firespace.
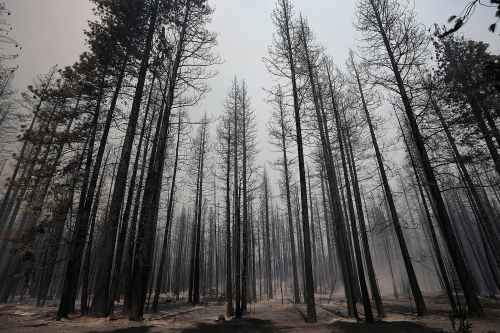 Burnt Trees Shortly after Rimfire Getty / Justin Sullivan
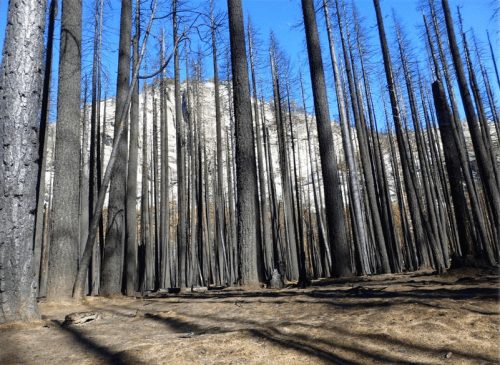
Sierra News/Candace Gregory (2015)
The terrifying rapidity with which the 2013 forest fire spread to become the largest-ever fire in recorded memory in the Sierra Nevada mountains posed such difficulty to be controlled from the middle of August that demanded to be mapped, but its expansion challenged the adequacy of mapping tools. The fire not only led to evacuations from the park as it extended into northwestern Yosemite, and to call for increased numbers of forepeople to control the blaze, as its shifting distribution and spread pressed so many firefighters into active duty to contain its growth, by both representing and masking its causes for and proportions and the difficulty of controlling its spread.
For although a number of fires occur yearly in Yosemite Park–either by lightning strikes, unattended campfires, or lapses of attentiveness, the specificity of the 2013 rim fires’ spread was due not only to its expanse, or proximity to Hetch Hetchy Reservoir, but to the winds that drove it, which distinguished it from other fires that are more easily controlled. For the rapidity of the spread of the fire distinguish it from the range of wildfires along the west coast that Ben Jones, using government data, mapped from 2002-2012 in Tableau.
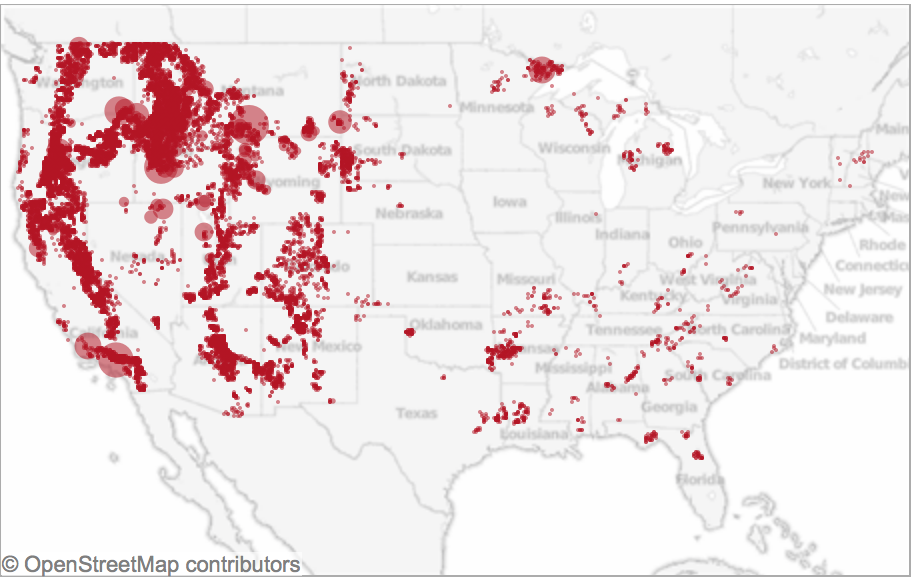
Whereas most of the fires that occur in the western part of the country were during the summer months, and most were caused as a result of lightning strikes, the vast majority were less than a quarter acre in size–and only a handful (one hundred and fifty-eight in a decade) exceeded 5,000 acres. The fire of 2013 consumed over 250,000 acres, making it a striking challenge and almost unique case to map its geography and spread–and providing an almost predictable worst-case scenario given the radical reception of the snow-pack in the Sierras that year–a decline that has only continued in recent years.

Yosemite Conservancy–Snow Pack around Half Dome
Much as the weather systems in the Valley and mountains are notoriously difficult to forecast or record, the winds–like the swaying of the slender Lodgepole pines, among the first to move into a burned environment, or the increasing density of trees across the Sierra Nevada, or the density of old-growth trees as the Douglas fir or Ponderosa pines that fill Stanislaus and Tuolomne counties, and run into the confines of Yosemite outside which they lie. And yet we are compelled to turn to the maps that so elegantly charted the troubling progress of the fire over a sequence of days, drawing out the progress of forest burning over weeks, even as we were fed new maps daily, together with weekly composites, of the progress from which we were perforce geographically removed. Watching and mapping the spread of the fire became increasingly dramatic and compelling precisely because of the difficulty with which it was contained–as if the fire resisted the abilities for synthesizing and bounding its own spread as it rushed in high winds across tree tops, breaching the boundaries of roads and approaching areas of denser settlement.
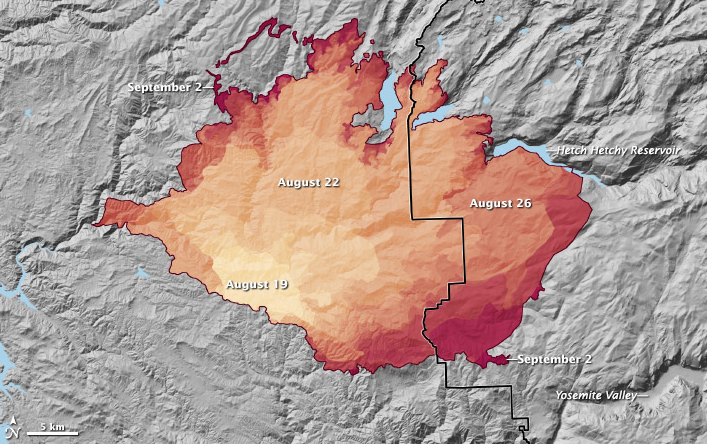 Spread of the Rim Fire from August 19 to September 2, 2013, as reported on InciWeb. Credit: NASA Earth Observatory
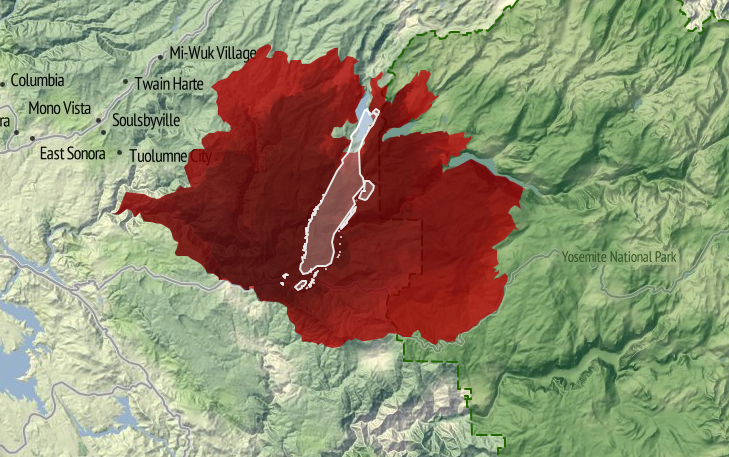
After consuming over 257,000 acres, the Rime Fire is 92% contained–two giant sequoia groves preserved–and trapped in a fixed perimeter at a low intensity, and the number of fire-fighters down from over 4,500 to 287. But the rapid expansion of the fire raises questions of containment, continuity, and scale beyond the categories we can most easily comprehend–say of cities such as Manhattan island, here trapped in the red expanse of blazes, or Berlin–images that adopt the familiar format of territorial maps. For while these images effectively communicate the size of the region to which the blaze expanded, they also create a false equation by which to understand its origins, spread, or possibilities for its eventual containment.

But such mapping of expanse provides little communication of the nature of its human causation, or of the difficulty in the reversal of its spread, while they impress its expanse. The values of measurement, scale, and proportionality which determine the construction of maps provide less value as criteria to map a fire that is able to leap from the underbrush to branches and the crowns of red pines, sugar pines, cedar, ponderosa pine and Douglas fir–among which fire travels in ways less understood by metaphors of terrestrial continuity, whose rapid expansion is facilitated and fed by decades of neglect at thinning forests on the park’s perimeter on account of substantial reductions of funding for adequate preventive firefighting by controlled burns of underbrush. (And the consequences of such reductions will be felt further by drought and higher, where the temperatures in the western United States bound to increase fire frequency by drying and warming landscapes.)
The result created something of a tinderbox in the Stanislaus forest, where the extensive undergrowth helped to ignite the fourth largest forest wildfire in California since 1932–a blaze that only slowed as it met far less underbrush in Yosemite National Park itself, where it also encountered far less dead wood, overgrown forests, and debris on the forest floor.
 Justin Sullivan/Getty Images
If the terrestrial map provides a poor visual metaphor for the communication and progress of the fire, maps also provide limited tools to understand the dynamics of fire containment. To speak of “footprints of actively burning fires” in Yosemite Park not only misleads. It mis-represents the abilities for the fire’s containment and impending danger of its astounding spread from a small canyon in the Stanislaus Forest. Unlike the image implied by a single ‘footprint’ of clearly defined bounds, multiple fires that have spread from Yosemite Park’s rim into the park itself in ways that cannot a single block or region, as is by now increasingly evident with the spread of the fire Labor Day weekend into the San Joaquin valley and the spread of smoke into the Valley itself, obscuring the very views for which the park has been so long known with dense smoke and leaving a burning smell in the National Park that has not only symbolic resonances as a region of protected wilderness, but is a historic example of the protection of a preserve of wildlife and old forest growth. It is difficult to register the destruction of space and place watching the spread of the fire’s leading edge over several weeks on an animated map of its almost unstoppable progression: http://gu.com/p/3tgff/tw.
To be sure, the historical spread of fires in the park due to lightning strikes can be understood as a process of forest management, as Kate Wilkin has shown by using color-coded polygons to trace the quilt-like nature of historical fires in the mixed conifer forest in Illilouette Creek Basin in the Upper Yosemite wilderness.
[youtube http://ourenvironment.berkeley.edu/where-fire-working-california]
The quilt-like nature of historical forest fires in the park however contrast to the immediate ways that we map the progression of a fire. The mapping of the expanse of a fire that crosses roads, boundaries, and other mapped lines poses problems that are not only cartographical in nature, but address the effectiveness of communicating the fire’s spread to the interested public–and the danger future wildfires pose. The demand for compiling an updated image of the fire’s progress in the hopes to capture the destructive phenomenon that raged for several weeks and consumed an expanse of over 350 square miles–almost 100 of which lie in the boundaries of Yosemite National Park–and which threatens to overwhelm and destroy its precious landscape. For most maps fail to embody the fire’s own contours, causes or impending expanse.
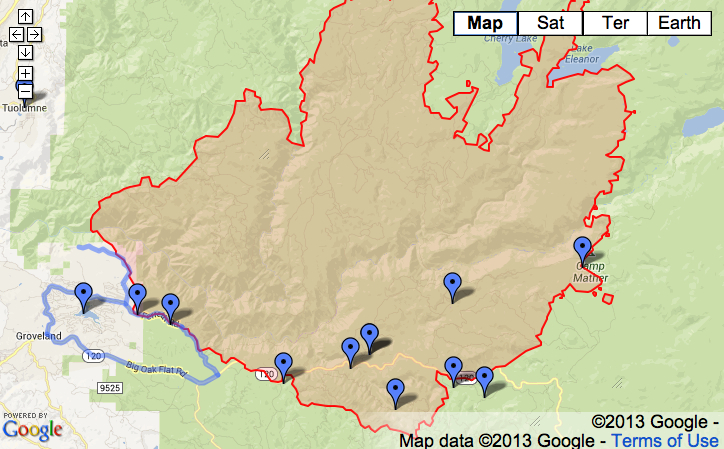
Repeated re-use of the “footprint map” of the fires in media outlets minimize the facts of its spread or existence of a clear perimeter around the “rim” fire by confining it to a fixed area, in ways that the animated map recapitulates in mapping the gradual if jerky expansion of an ink-stained red expanse to fill nearby canyons and valleys as it comes to border and surround the Hetch Hetchy reservoir itself. Indeed, much of the fire that has burned in the Stanislaus Forest has remained off the radar–though this has been where most of the burning has occurred–given the dominant media focus devoted to Yosemite Park’s wilderness–and the region’s iconic status as protected wilderness in the national imagination: indeed, the fire is more compelling than the fourteen active or contained fires in the state that are mapped on the California State Fire Map by transposing CAL FIRE data to a Google Map of the region, replacing the usual pinpricks by swirls of red flames to denote alive fires, and white flames to denote those “contained.” A “contained fire,” in this iconography, commands less visual attention, if not being discounted–despite the map’s benefits viewers, the remove of its map signs from the landscape they are overlaid is a particularly perilous way to foster public discussion about fire dangers.


The moral failure of abdicating abilities of creative mapping to communicate the process or movement of fires has severe implications for our ability to appreciate, understand, and combat their spread–especially in the benign construction of the containment of a fire’s spread. Similarly, notwithstanding the intent to try to map the entirety of the area engulfed by flames, the mutable areas engulfed by fires and the discrete paths of its travel, and the travel of smoke or ash, are masked and left silent in the mapping of its “footprint.” Unlike the “footprint” of a building, house or complex, indeed, the fire resists definition by boundaries, or to be easily controlled, although that image has been repeated in new stories about the “rim fire” that cannot be safely contained, as if to quell fears of the difficulty of drawing boundaries around its recently expanding brushfires that threaten greater destruction of the oak, pine, and older growth trees in the park’s upper reaches. The 94 square miles of national wilderness consumed by fire in northern Yosemite over Labor Day weekend, up from only 74 square miles the previous day, have been unable to be contained because dense smoke obscures aircraft visibility sufficiently to obscure pilots who might otherwise drop water to contain the blaze, although they have since begun to fly once more as of September 1.
The difficulty to map changing nature of the fire–and the limits on firemen’s ability to control it–need to be better registered and more effectively communicated if it is to be adequately described. For even if it is tempting to isolate the burning region as removed from the most-visited destinations in the park or locations of many campsites, the failure to map the fire both conceptually seems an obstacle in clarifying its dynamic–or even the plurality of fires that have begun to burn. Given the small portion of the fire controlled, which grew quite slowly from 2% to 9%, given its poor accessibility, and, only more recently, to 12% and 15%–as if the doubling of the percentage under control could match the expansion of the wildfire, its mapping might better reveal the obstacles to control its spread, indeed, rather than process a set region or place that has been evacuated of inhabitants. It’s unclear, in short, how maps of the fire process the disaster’s scope or meaningfully present the relation of firefighters to it: if not negligible, the relatively minuscule share of controlling its rapidly growing expanse rely on Google Maps to chart the fire’s expanse in relation to human habitations or sites of evacuation in problematic ways; maps of the fire’s perimeter and coverage inadequately represent the disaster’s situation or dimensions, and their re-use in most newspaper and media outlets confuse the fire as a human event–or an event that impacts human settlements–even though it surely does in part. But the result is to confuse the object of the map, and the nature of the fire with its threat to residences near to or in the park, and the drama of resettlement outside the most threatened region.
 August 24, 2013 map of closures and evacuations in park
 Map the US Forest Service website, August 24, 2013
For the impact of the fire is surely its destruction of a habitat long preserved and sanctioned for wildlife in the Sierra: a map of its relation to sites of human evacuation suggest only a small part of its impact in an area long preserved from settlement, by privileging areas from which residents have been asked to relocate or withdraw–and fatally confuses or misrepresents the nature of the fire by privileging its relation to human settlements and sites of evacuation, as if that would magnify its dangers. The dryness in the forests that have contributed to their spread remain unmapped in such schematic projections, as are the currents of high winds that facilitate its spread, as the fire remains a block to be combatted and confined–its flickering boundaries in most maps of the region are a reminder of its extremely rapid spread. The inadequate nature of abilities to map its rapid spread inside the borders of Yosemite Park, or to control its rapid progress in the back-country just four miles away from Hetch Hetchy Reservoir, and then at the reservoir, posed deep questions of how to map the growth of and control over the fire, and the ways that maps of fire communicate a convincing relation to its spread by demarcating a fixed perimeter in red–or shading the entire firespace in red.
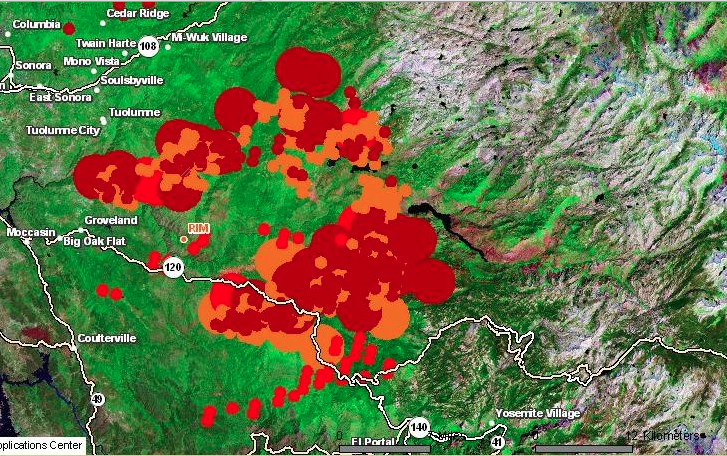
This is not to say that there is an absence of maps of the fire’s spread, but that they are–in general–absent form the news cycle, in its search to provide an up-to-date snapshots of the fire’s progress and the impact that it is having on human settlements. The spread of the fire from a canyon in the Stanislaus Forest provides a compelling image of the spread in high heat with prevailing winds, moving in jumps from the upper branches of trees as well as passing along the dried out underbrush. But few, as below, use an informative backdrop of the potential for fire-risk to plot the fire’s widening perimeter, compiling data of fire progression over the weeks of August 17-28 by GIS software to orient viewers to the fire’s rapid expansion and to the dangers of the fire’s further spread:

The powerful overlaps of data in the Esri map that integrates wildfire potential in the region with the fire’s spread uses layering of data to create a dynamic surface to map fire progression. In sharp contrast, images deriving from Google Map templates place pastel pinpricks to individuate sites of evacuation in the parks in a field of green, as if to allow us to read the spread of the fire a human story in a far more static map–relinquishing responsibility to map the spread of the fire. More than providing actual or precise information, the maps are removed from the fact of the fire–which is oddly absent from them, as is the nature of the fire’s rapid spread. The presence of the fire is even muted by the placidly pale iconic markers that Google Maps employ–periwinkle markers and a light green screen–seem antithetical to the violence of the very fire it charts, or the brush, oak, and pine that fuel its continuing spread. One would not know that the fire has been burning for more than a week, or that it was in danger of consuming some 225 square miles, and could easily send out sparks a mile and half beyond its current perimeter. As the rim fire in Tuolumne County, CA has expanded far beyond 150,000 acres–four times the size of San Francisco–little help or solutions seems to materialize for its extinction, even as huge amounts of flame retardant and water are dropped over the region by fixed-wing tankers. More recent visualizations of the fire incorporate the icon of an isolated yellow flame in a map of evacuations, closures, and shelters for evacuated outside the rim’s periphery.
 Los Angeles Times DataDesk, August 26, 2013

 SF Gate, August 27, 2013
But attempts to chart the huge damage of wildfires in terrain maps of the “rough footprints of actively burning fires” can barely communicate the progress of its destruction. From a small canyon fire, the brush fire has consumed oaks, pine, and threatened giant Sequoia trees, in what might be the largest recorded wildfire in California history: it resists being mapped. In fact, rather than being contained, in other words, the problem of mapping a fire never more than 7% contained has not been confronted by the news agencies that pretend to map its spread. The stop-action image of a bounded range of danger suggests an almost wishful level of control over a fire that has increased in size by over 10% each day, the slow growth of the proportion of its containment from 5% to 2%, back to 7% and then to 15%, if comforting, seem less statistically meaningful–especially with at least fifteen more days expected until the fire is contained in mid-September. How much more likely is the lack of control only to grow as it expands?
The map is mute on these questions, or barely registers a response. More problematically, the maps “lie” in drawing clearly demarcated boundaries of control for the viewer, to use Mark Monmonier’s phrase in How to Lie with Maps, reducing the multiple effects of the raging fires to an entity mapped only in relation to settlement–despite its far larger destruction of the wild–erases how the fire has transformed the land. An early image from the Los Angeles Times confined itself to highlighting spot fires in the perimeter that was threatened seemed to conceal the fire’s rapid spread in almost every direction of wilderness in the National Park as much as they illustrate its danger zones:
If all maps are translations, the ability to translate how fires have spread from a small brush-fire of some 400 square feet in a remote canyon of the Stanislaus forest to consume over 250 square miles challenges the ability of any map. The distribution of fires on August 23 was already less circumscribed, as the rim fire seems to have rapidly expanded along the mountain tops, light orange clouds providing evidence of recent burning. Shifting mapping to a terrain-view, and measuring fire activity, raises an entirely different set of dangers, in this map of August 23, if the ring of fire still seems limited to the rim, and only vaguely suggesting the danger of its spread and the limits of being at best only 5-8% contained for several days, if containment has grown to 20%:

Indeed, the map conceals the lack of much of a strategy to deal with a blaze that has become increasingly difficult to contain save by letting it burn itself out. While the map of boundary lines lain over a landscape map is removed from the nature of the fire’s progress, the recent perimeter of fire is oddly removed from the fire’s effects in comparison to the map of its progressive expansion from Stanislaus Forest to the border of the National Park.

A more recent map, including a further array of MODIS satellite-sensed thermal hotspots and active fires in an Esri overlay map provides a more realistic, if substantially scarier, image of its evolution as a growing heat source–the practical problems of mapping the fire’s expanse to an entire shore of Hetch Hetchy Reservoir also suggest the steep challenges of its containment.
 SF Gate, August 28, 2013
One of the deepest worry of many in reaction to the maps is of course the relation of the fire to the landscape. The fire of course threatens the region of wilderness that the park was dedicated to preserve–a nationally sanctioned wilderness within Yosemite park whose pristine old-growth forests that have been enshrined in our collective memory within a long tradition of American photography. The mythic photography of Yosemite’s wilderness was nicely undermined in Roger Minnick’s famous 1980 color chromogenic print of a visitor contemplating the Valley’s glacial waterfalls from Inspiration Point–her hair pinned up within a kerchief of its prominent sites. Despite the touristic appeal of the region, the image of the natural splendor of sheer rock cliffs, waterfalls and trees remains a central to the American imagination of wilderness.

Some maps distance worries of natural destruction by placing the National Park at a reassuring distance from the raging fires, accentuating the fire’s distance from the Valley, and the old-growth regions of giant Sequoia–mapping the expanse of the park in relation to the more delimited region fires have spread, as if distinguishing the smaller bounded region that is burning from a much larger whole, as in this fairly uninformative map that seems to separate the fire from the park, which is silent about the pathways of the fire’s spread or expansion.

If maps draw boundaries, this map from USA TODAY draws a clear distinction between a red region of 133,000 burnt acres and the park’s wilderness. But the problem of understanding the spread of the fire through the area gives rise to the deepest anxieties around its expansion, many of which focus on pressing questions of the relation of the fire to Hetch Hetchy, the dammed-up glacial valley turned man-made reservoir that has fed San Francisco and the Bay Area since the late 1930s, and to which the spread of the fire is perilously close–and firefighters continue to watch carefully a reservoir that is surrounded with blackened, defoliated trees for signs of new fires, beneath a black blanket of smoke. As ash falls in snowflakes into the drinking-water reservoir, we are told repeatedly that purification systems are in place, although it is less often noted that the fire has interrupted the production of a huge amount of hydroelectric power, or that San Francisco Public Utilities Commission quickly spent $600,000 to purchase power on the open market at considerable cost, fearful of the imminent dangers posed by the fire’s rapid spread–and the perilous proximity of the blaze to Hetch Hetchy Reservoir have led its power plants to be closed—although even after the fire reached the reservoir, we assured drinking water would still be safe.
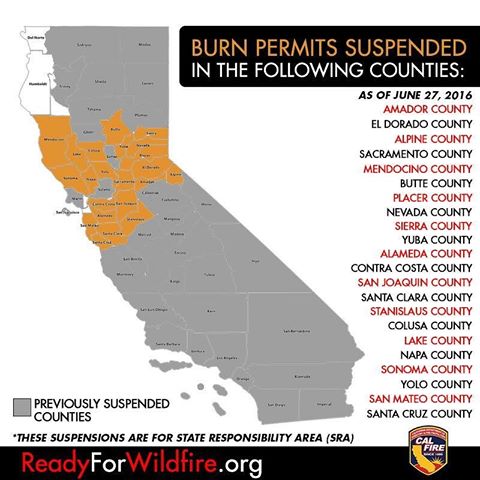
Yet as the fire spreads, even at 20% contained, the threat of particulate matter entering the drinking water that the reservoir supplies is not over. Meanwhile, the older trees and considerable biodiversity that provided a rallying cry for the Park’s creation from the 1890s are now threatened, as, continuing the military metaphor of combatting the fire, the San Francisco Chronicle has asked if the giant Sequoia have “finally met their match,” as if preparing to say goodbye to the oldest trees in the park that Roosevelt loved–and that have lived in the park for over 1,000 years. The maps disseminated in the news do not often register the lack of rainfall in the region, often noted by some commentators on the fire but crucial to comprehend both its spread and the challenges of extinguishing the wildfire. Fires are not that uncommon in the state, or Northern California’s forests and parks, based on national climactic data; but if fire-risk is widely measured and announced, maps give immediacy to that risk: over 400 square miles of forest fires are being combatted across the state by over 9,000 men and women. While the map may minimize the expanse of the Yosemite fire and its , and risks naturalizing the spread of fires across the state, a map of the eight fires currently burning in Northern California reminds us of the constraints by which they would be adequately able to be controlled.

The multiple sites of wildfires, and the muting of the dangerous phenomenon by abstract icons, do remove relative the experience of the fire and its danger. But the image of the designated area of wilderness perhaps most feared to be threatened and violated by this year’s out-of-control rim fire–the fear of whose loss may be tragically prefigured by the emblematic loss by incineration of Berkeley’s Tuolumne Family Camp outside the park, whose buildings and trees were obliterated by fire on the weekend of August 25, having served campers since 1925. The burning was commemorated in a recent public vigil in the city of Berkeley, CA, a poignant expression of loss amidst mind-numbing procession of images of flames. For the symbolic nature of burning in a pristine region of wilderness, less accessible by roads and less able to be travelled by vehicles, lies at a base of the many anxieties about the forest fire in the news. Indeed, the sanctioned nature of the Yosemite Wilderness as distinct from a simple National Forest, and existing with its own decorum of wildlife conservation, and a relative minimizing of human garbage or refuse, and of power vehicles, is a preserve of wilderness region whose loss would be even more incalculable:

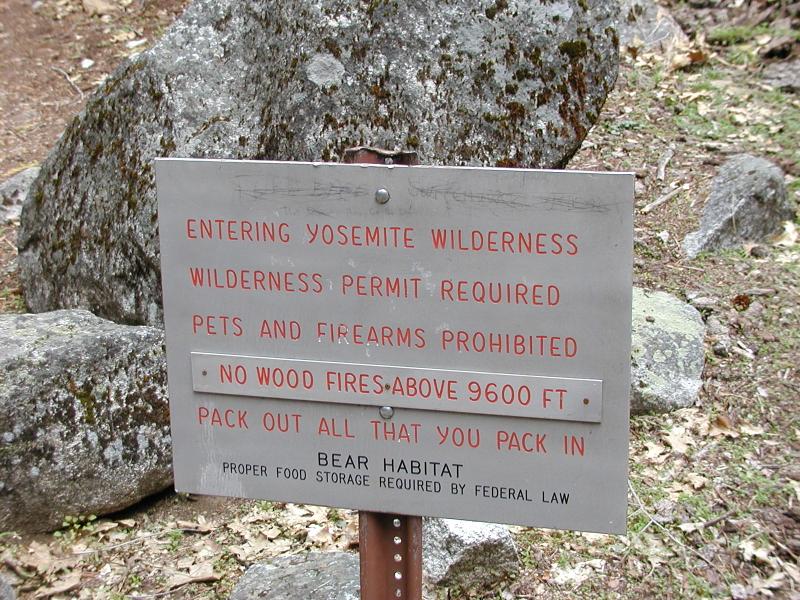
The demarcation of “wilderness” may seem obtuse, either as a designation in need of designating (in order to be protected). But it reflects how few areas of wilderness exist: the mythic pristine nature of the region, and the danger that its very inaccessibility poses to fire control, combined with the danger of fires to the densely forested area, filled with dry, dead wood as well as underbrush, making the fires so difficult to contain by firefighters or equipment, and suggesting something of an inevitable narrative of loss and destruction that works toward its tragic denouement. A significant part both of the compulsion and oddity of attempts to map the fire’s spread is the very contingent nature of any mapping of wildfires, and the fact that one is mapping something that is difficult to contain–as opposed to containing an image of nature readily comprehended in a map. The purportedly unforeseen velocity with which the fire spread of course make difficult any single capture of events within a map difficult–and even more difficult than mapping lines of military engagement and war. Metaphorically mapping the fire as engagements on a line of combat begs questions of how the fires might ever be contained–save by burn-out fires that attempt to stave the fire’s spread by controlled burns, downwind of the larger fires, between the perimeter of the main fire and a line of control.
 Jae C. Hong / AP
These fires raise questions of the dangers of identifying the fire as a single entity in need of monitoring or control. What is being mapped in a plot of burning trees, when fires in the upper branches notoriously jump from tree to tree, in ways difficult, or extremely challenging, to control from the ground? Should one map vectors of transmission, and intensity of heat, as well as location? Or the high winds that now threaten to carry the fire further north into the park? These are aspects that seem to challenge the conventional newspaper maps that use Google Maps templates to locate the fires–and are difficult to digest because they effectively rhetorically diminished potential impact of a fire that would so rapidly spread, even in trying to map it to discreet locations in space that have been identified as dangerous to human populations, obscuring the nature of the burning across the region.
These maps diminish the danger of the fire in a sense, by omitting the extent to which the extraordinary dryness of the region will only lead the fire to spread rapidly. What is the way, one must ask, that fires travel or “know” space, or what sort of continuity exists for fires that the notion of a mapping of terrestrial continuity fail to show or reveal? The question of the further igniting of fires, or the time-indexed travel of fires, is a bit more challenging to read, but far more informative as a model to understand the problems of how it can be combatted or contained, and the manner that it threatens to impinge on the so-called “green perimeter” of the forest itself–even minimizing the fragility of the perimeter that is shown as if it were a fixed line. More importantly, perhaps, they shunt aside questions of how the fire would be contained and provide limited public understanding of the disaster, by perpetuating the image of a contained disaster, even as banner headlines scream about the rapidity of its expansion in the air in a region that has long been parched without rain, and whose high risks for fire were long noted. This map, of August 23, provides a view of the initial spread on Friday, based on the US Forest Service’s Remote Sensing Applications Center (RSAC), based on the analysis of spectral bands in satellite imagery of areas with expanded wildfires better to visualize local variations in the intensity and spread of fires in expansive regions as Yosemite National Park:

And reveals its approach to Hetch Hetchy’s shores, and rapid spread to the center of the rim–and the set of consequent dangers to water supplies minimized in recent news reports of Monday, August 26:

The spread is evident from the intensity with which wildfires spread during the previous day:

The value of this map, of course, is a primary concern with mapping the fire’s spread, then situated within the human settlement of the area, but using map conventions to fit the unique characteristics by which they fire spreads. Already one can see the stark spread of the fire over an entire region, and the relative impossibility of containing the inevitable inward spread of the fire from the rim, toward what seems an inferno of dense pine and oak, as well as burning overhead threatened giant Sequoia trees and redwoods.
Although the techniques specific to active fire maps are widely used specific to the Dept. of Forestry, a panicked tweet urgently worried that the fire’s spread had been minimized (and inadequately mapped) to reduce the extent of the fire by August 25, as if the spread of the fire toward the end of had been suppressed–and the proximity it seems to have gained to the Valley and to Yosemite Village.
The influx of large numbers of fire fighters from other states helped contain the fire, by last count, some 15%, a statistic that might mitigate its current spread. But little has been said in the media–until quite recently, and then only in select places–about the relation of this fire’s spread to a Congress that depleted needed funds for fire-fighting abilities or fire-suppression technologies. If a casuality of the 24-hour news cycle, the budget cuts come not only from fiscal irresponsibility but a reluctance fueled by stubborn refusal of climate change deniers to recognize that the forests have become increasingly flammable, as water as diminished in such areas as the region of the High Sierra. Even as the fire rages, the US Dept. of Agriculture mandated a spending freeze on forest restoration programs and firefighting budgets to help maintain fire awareness at high levels, although the Dept. of Forestry has spent more than a billion dollars on fires suppression this year, and 1.9 billion the previous year. This may well be the unspoken story lying within the story, and the one whose effects are still waiting, tragically, to be adequately mapped.


